
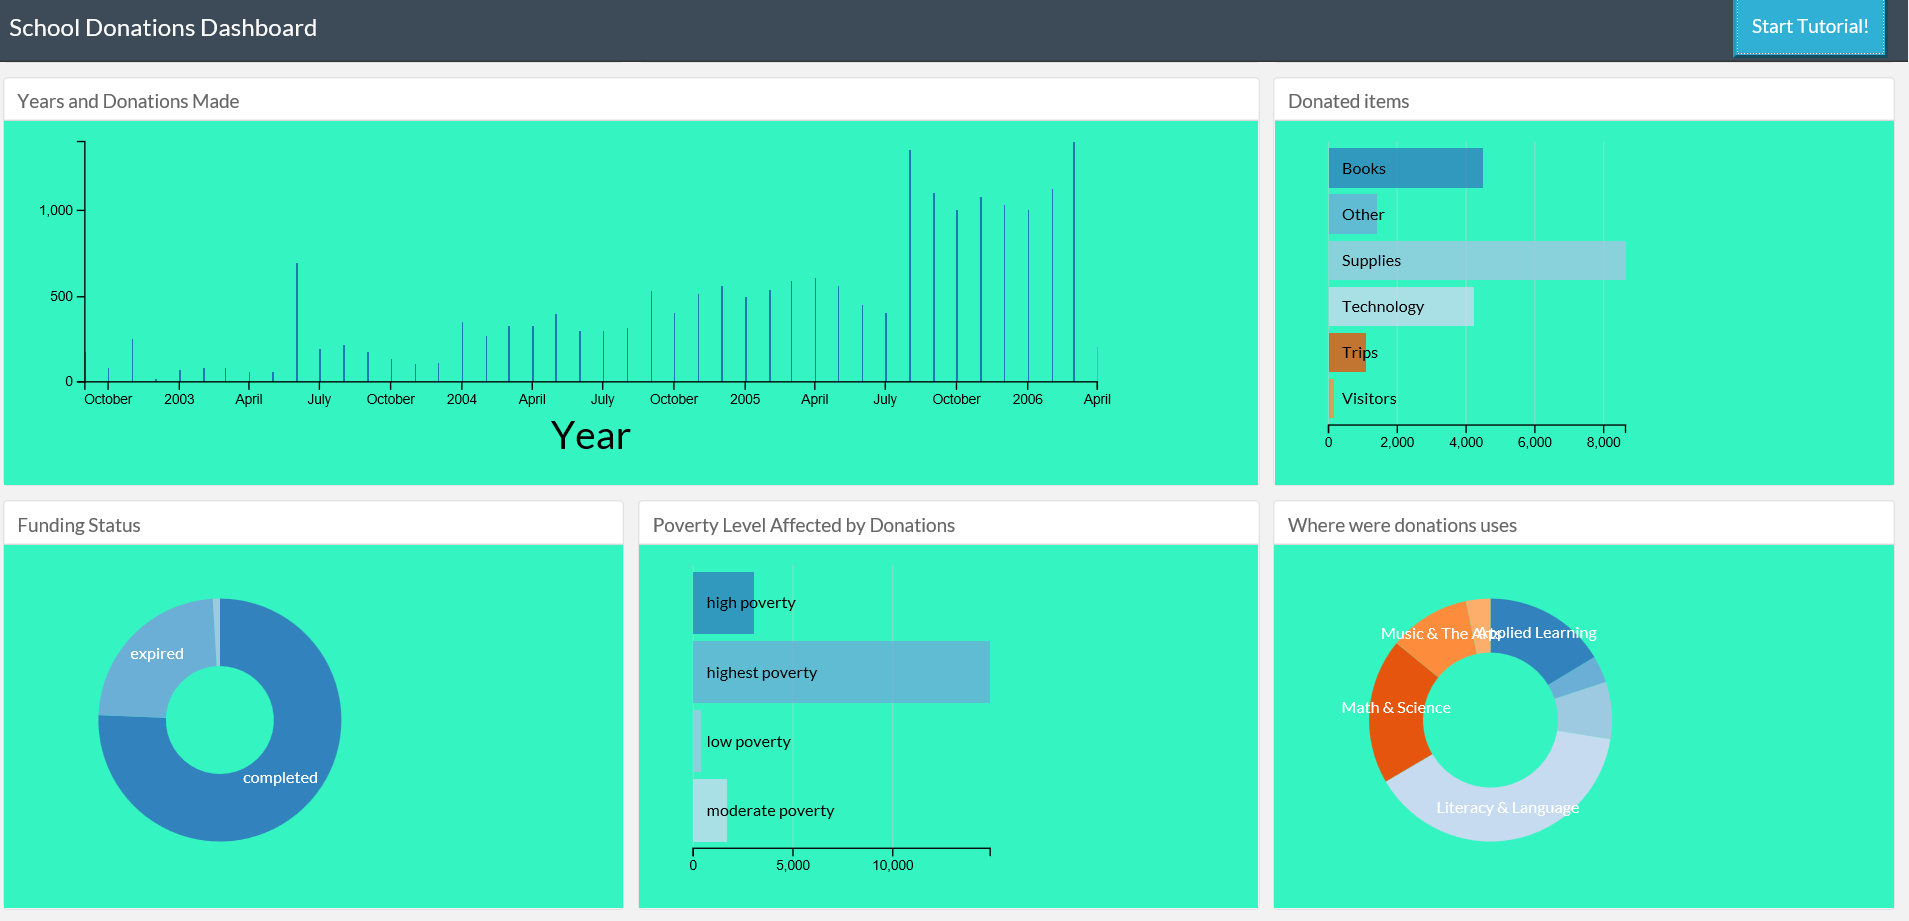
Check a dashboard that I developed for schoolsdonations.org on Heroku.
It shows the donations made in the US for schools. The app runs through 20k data entries and builds up interactive graphs which are then rendered in the view. The User can visualise the graphs changing in real time without the page reloading. A tutorial has been added to familiarize the User with the app.
Technologies used to build it:
• Flask framework,
• MongoDB database (data used belongs to DonorsChoose.org),
• Bootstrap,
• dc.js, D3.js, crossfilter.js – for creating the interactive graphs;
• intro.js – to build a tutorial for the dashboard,
• GitHub for version control,
• deployed to Heroku.
